UpMetrics is the top social impact measurement and reporting platform, connecting organizations that fund impact (foundations and impact investors) and social good organizations (nonprofits and portfolio companies).
Unlike Power BI, UpMetrics was made with social impact reporting and measurement in mind. Learn more about how these two tools stack up and why to choose UpMetrics.
Active Users
Capterra Rating
Avg. Reduction in Reporting Time
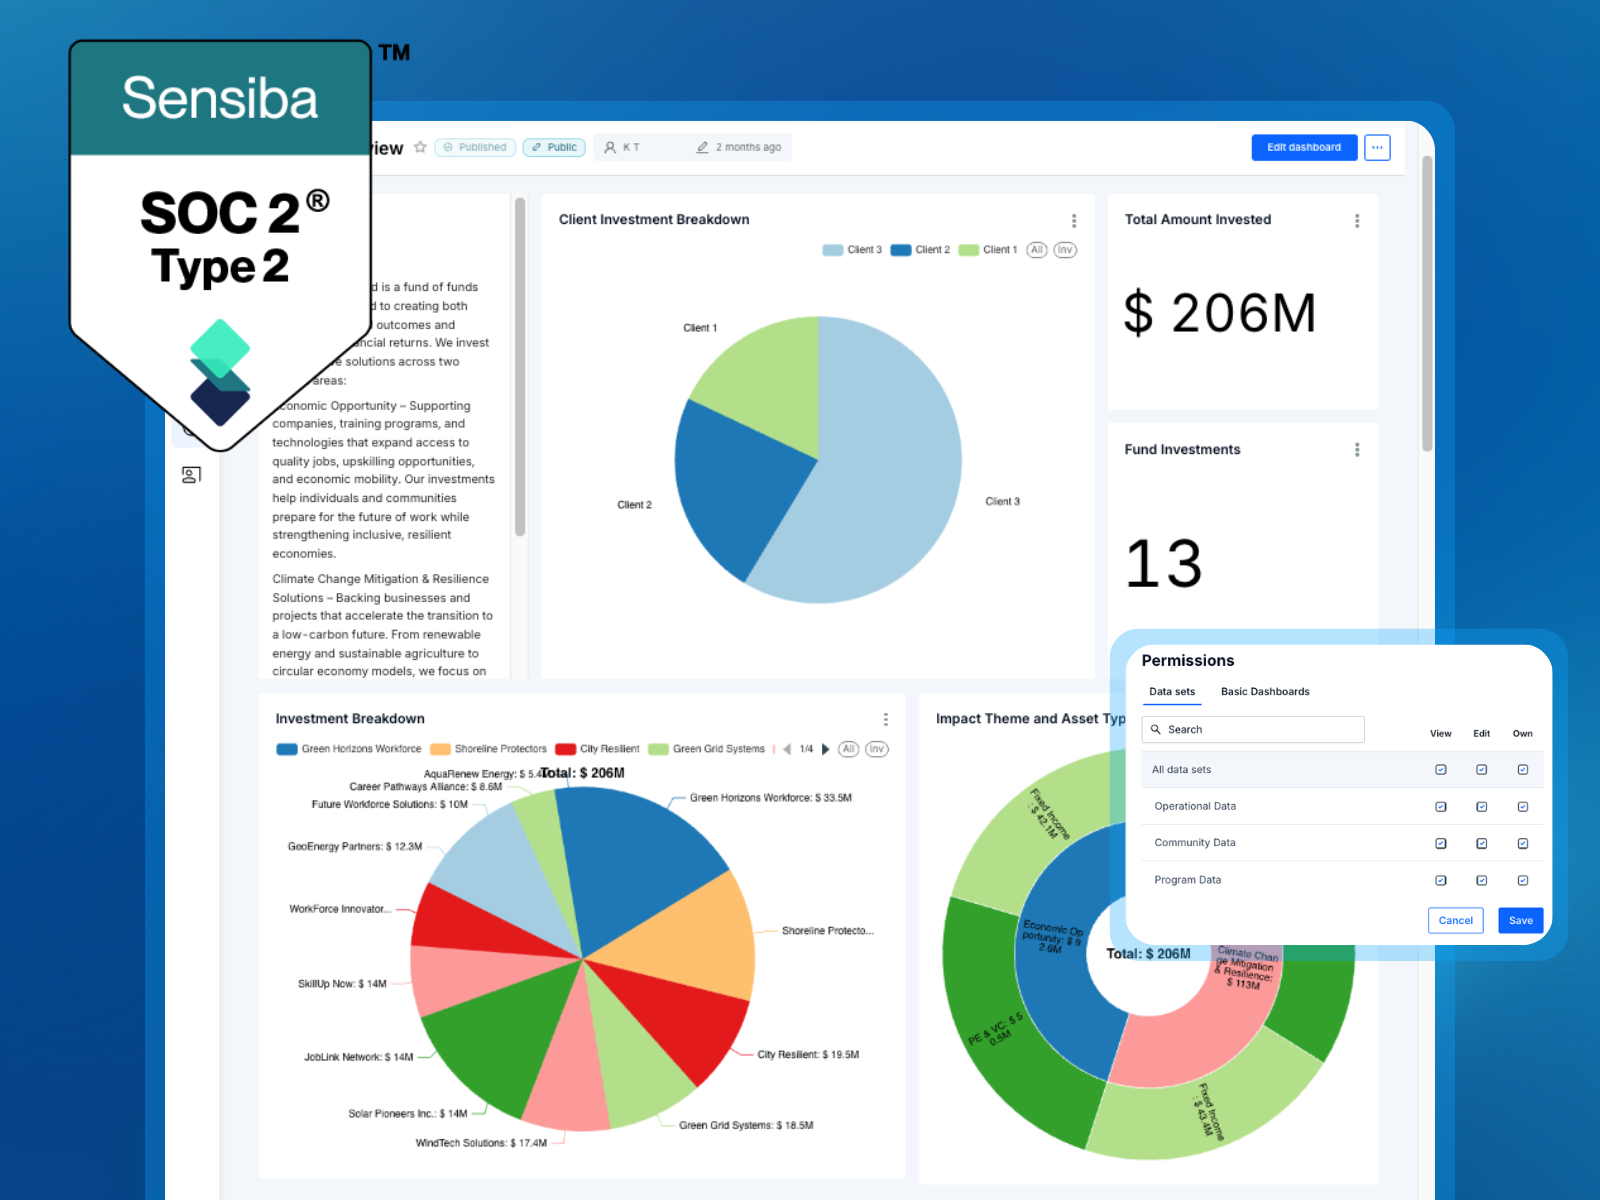
Type 2 Compliant
UpMetrics provides organizations with all the tools they need to measure their impact. Teams measuring impact can define key impact indicators (KIIs), build custom intake forms, and track submissions in real time. From there, you can centralize data, run visual analytics, and publish qualitative field stories.
Built for the unique challenges of philanthropy and impact investing, UpMetrics reveals fresh opportunities and highlights operational needs, turning routine evaluation into continuous iteration and improvement.
UpMetrics bridges the gap between organizations that fund impact and their social good partners, simplifying impact reporting and ensuring important information doesn’t slip through the cracks. Power BI, on the other hand, is built for sharing finished reports and doesn't facilitate easy information sharing.
When impact reporting doesn't require stitching together disparate sources of information, teams can spend more of their week using their data rather than assembling it. UpMetrics centralizes the most useful tools these organizations use to make decisions, from data collection to the creation of shareable report dashboards. As a purpose-built impact reporting platform, UpMetrics offers more impact-specific functionality in one place than Power BI’s generalized tools.

QUALITATIVE DATA ANALYSIS
Capture the stories, photos, interviews, and testimonials behind your numbers, and make them as analyzable as any quantitative metric.
Structured coding, categories, and program associations let you organize qualitative data right in the platform, no exporting or spreadsheet cleanup required. From there it feeds straight into your dashboards, painting a complete, contextual picture of impact that numbers alone can't tell.
Released August 2026. Learn more →
UpMetrics is passionate about social progress, and the team cares about the organizations that use our tools. We offer comprehensive service add-ons that allow us to work alongside customers, providing the hands-on guidance, expert coaching, and resources required to make a lasting difference. The majority of our team has direct experience within the social sector/social impact space and brings that specialized, first-hand knowledge/experience to our work.
REAL-TIME ANALYTICS & DASHBOARDS
Turn complex impact data into a live, explorable view of performance.
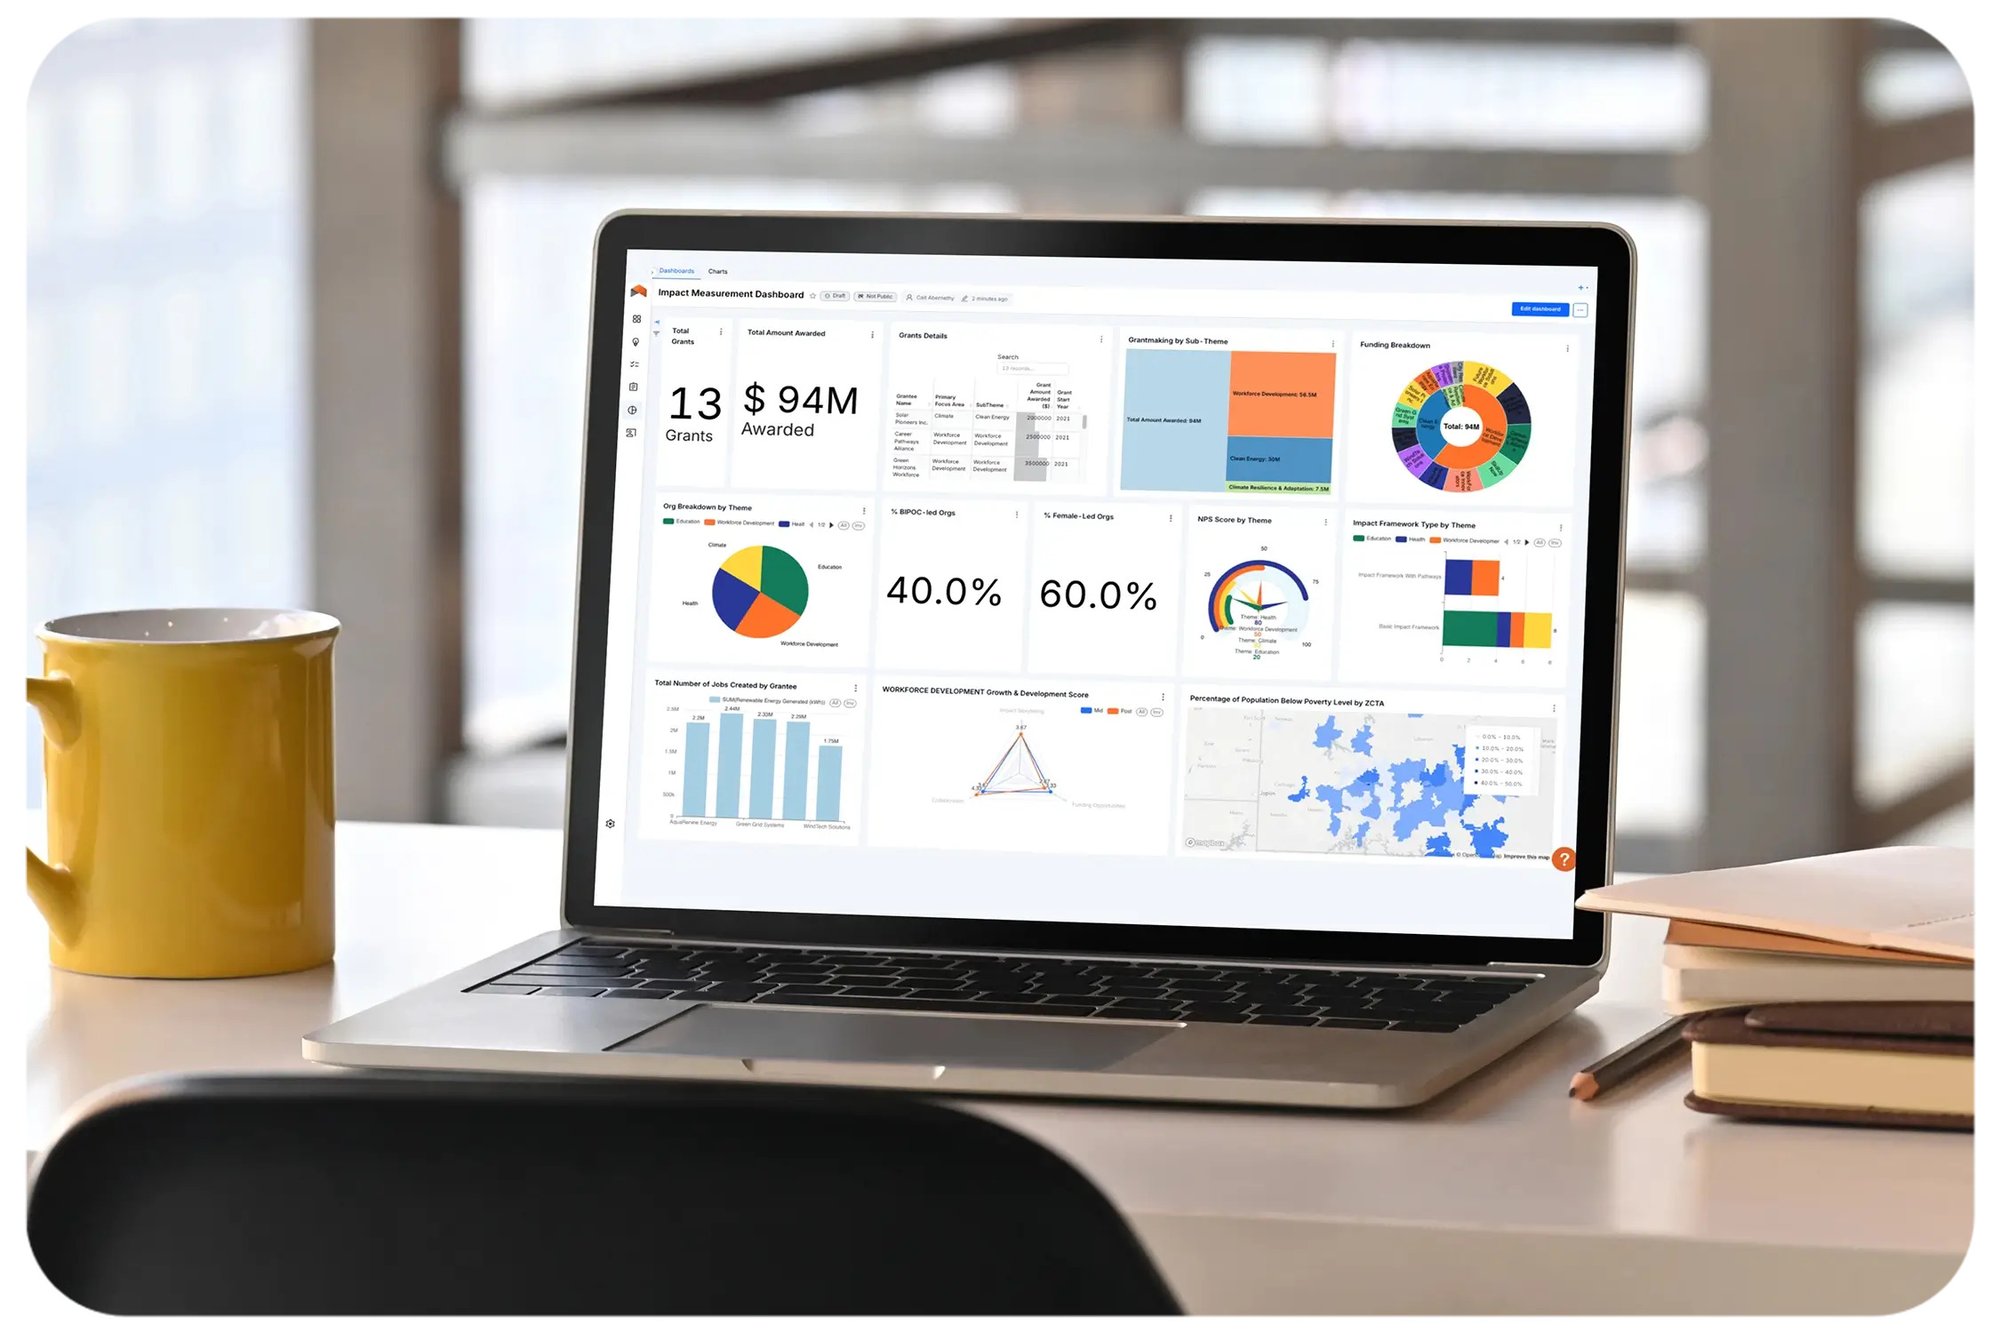
Dashboards update automatically as new data comes in, giving you real-time visibility from individual program results to portfolio-wide trends. Filter by theme, geography, or time period, benchmark across programs, and drill down or roll up as needed. For teams that want to go further, you can write and run custom queries directly against your data for on-demand analysis, without leaving UpMetrics.
It's impact analysis that helps your team make decisions in the moment, not just at year-end.
REUSABLE, READY-TO-SHARE VISUALIZATIONS
Create charts once and reuse them across multiple dashboards — when data updates, every instance updates automatically.
Customize dashboards for different audiences, share via public links or embedded charts without exposing underlying data, and combine metrics with narratives to tell the complete impact story.
No reformatting, no version control. Just current, compelling data wherever your stakeholders need it.
ROBUST SECURITY & ADMIN TOOLS
Role and user-based permissions let program teams, analysts, and leadership self-serve the data they need while keeping sensitive information protected.
UpMetrics' SOC 2 Type 2 certification ensures our security practices are independently audited against enterprise-grade standards, so your organization and stakeholders can trust that sensitive data stays where it belongs.
Stop stitching together survey tools, spreadsheets, emails, and PDFs. UpMetrics centralizes all of your data into one system so you can see the full picture of your impact.
Advanced analytics tools let you set targets, track performance against them, and understand where your impact strategy is working and where it needs attention.
The best reporting cycles don't just produce data, they improve what you do next. UpMetrics helps your team surface trends, flag gaps, and turn every cycle into an opportunity to improve strategy and outcomes.
Reporting shouldn't feel like an audit. UpMetrics creates a shared experience where data flows both ways, feedback is built in, and every cycle strengthens relationships rather than straining them.
Whether you're reporting to a board, presenting to partners, or communicating publicly, UpMetrics make it easy to share compelling and credible impact narratives.
UpMetrics automates the administrative work that consumes your team's time, freeing them to focus on strategy, relationships, and outcome delivery instead.
| Feature | UpMetrics | Power BI |
|---|---|---|
| Impact Framework Builder | Flexible framework dimensions allow you to customize an impact framework to your preferred model | ❌ No built-in framework concept; requires manual DAX/table modeling |
| Qualitative & Sentiment Data | Native "Stories" feature: sentiment tagging, coding, media attachments | ❌ Built-in sentiment tools retired in 2025; now requires custom Azure Language setup |
| External Stakeholder Collaboration | Grantmakers and impact investors can collaborate and view reporting submissions from nonprofits and portfolio companies in one place | ❌ Data entry requires bolting on Power Apps or Forms, and every viewer typically needs their own paid license |
| User-Friendliness | Drag-and-drop framework and dashboard builder, no coding required | ❌ Building custom metrics or data models requires DAX and Power Query skills |
| Data Collection & Survey Forms | Native two-way portal with survey forms, conditional logic, draft saving, and submission tracking. | Supported by embedding Microsoft Power Apps or connecting to Microsoft Forms for data entry. |
| External Stakeholder Collaboration | Shared two-sided portal where grantmakers/investors and grantees/portfolio companies submit, review, and track progress together in one system of record. | Designed for top-down report distribution; multi-party data entry or workflow approvals require custom Power Apps or individual user licensing. |
| Data Integration & Centralization | Centralized hub importing data from CSVs, Google Sheets, spreadsheets, CRMs, and external APIs into a single source of truth. | ETL capabilities sourced via Power Query, supporting many cloud, database, and API connectors. |
| Dashboards & Real-Time Visualization | Configurable and interactive impact dashboards with live filtering and drill-down options, reusable charts, public link sharing, and web embedding. | Interactive reporting, real-time dataset streaming, and advanced custom visuals. |
| Role-Based Access Control | Tailored audience visibility and role-based permissions designed for internal teams, boards, and external partners. | Row-Level Security (RLS) configured via DAX rules and managed through Microsoft Entra ID (Azure AD) groups. |
| Security & Compliance | SOC 2 Type 2 compliance and enterprise data security protocols. | Security backed by Microsoft Azure infrastructure and SOC 2 Type 2 compliance. |
HCAP Partners
Hope Mago, PartnerLos Angeles Dodgers Foundation
Dr. Kerry Klima, Sr. Director Organizational Development, Evaluation & ImpactNewBo City Market
Sarah Blais, Senior Director of Market OperationsIMC Chicago Charitable Foundation
Lisa Wiersma, Executive DirectorSJF Ventures
Anna Rumer, Associate Impact Acceleration and PlatformThe Campbell's Soup Company
Kate Barrett, PresidentEasy-to-use ensures new users learn to use prototyping tools.

This template is really nice and offers quite a large set of options.
Zachary Freeman
Director of Finance and Operations, Attendance WorksIve had the pleasure of working with Sprocket Rocket since its inception and find it to be an invaluable tool in helping modernize our HubSpot build process.
Meg Riley
Product Designer, GoogleThis template is really nice and offers quite a large set of options.
Mark Robinson
Product Designer, GoogleIve had the pleasure of working with Sprocket Rocket since its inception and find it to be an invaluable tool in helping modernize our HubSpot build process.
Meg Riley
Product Designer, GoogleThis template is really nice and offers quite a large set of options.
Mark Robinson
Product Designer, GoogleIve had the pleasure of working with Sprocket Rocket since its inception and find it to be an invaluable tool in helping modernize our HubSpot build process.
Meg Riley
Product Designer, GoogleUpMetrics helps us assess the effectiveness of new initiatives, monitor trends in our impact over time, and supports our fundraising efforts/reporting for funders.
Without them, all of these things would be harder, and some of them we might not be able to do at all.
Zachary Freeman
Director of Finance and Operations, Attendance Works"Ive had the pleasure of working with Sprocket Rocket since its inception and find it to be an invaluable tool in helping modernize our HubSpot build process."
Meg Riley
Product Designer, Google"This template is really nice and offers quite a large set of options. It’s beautiful and the coding is done quickly and seamlessly. Thank you!"
Mark Robinson
Product Designer, Google"Ive had the pleasure of working with Sprocket Rocket since its inception and find it to be an invaluable tool in helping modernize our HubSpot build process."
Meg Riley
Product Designer, Google"This template is really nice and offers quite a large set of options. It’s beautiful and the coding is done quickly and seamlessly. Thank you!"
Mark Robinson
Product Designer, Google"Ive had the pleasure of working with Sprocket Rocket since its inception and find it to be an invaluable tool in helping modernize our HubSpot build process."
Meg Riley
Product Designer, Google
Talk to our team about how UpMetrics can simplify and add value to your organization's reporting workflow - whether you're an investor, foundation, or nonprofit.
UpMetrics is a cloud-based, end-to-end impact reporting platform purpose-built for the social sector and impact investing lifecycle. UpMetrics’ features include:
Beyond the platform’s core features, UpMetrics also offers expert support services and capacity-building Cohort programs that help organizations make the most of UpMetrics’ tools and connect with social impact or funding organizations.
UpMetrics is built for the following organizations:
Some organizations are moving on from Power BI because of its:
UpMetrics is the top Power BI alternative because it:
Power BI starts at $14/user/month (Pro) or $24/user/month (Premium Per User), and costs scale quickly for foundations and impact investors. Plus, reaching feature parity with UpMetrics requires stacking on extras: Power Apps or Microsoft Forms for data collection, Azure Language for qualitative/sentiment analysis, and custom DAX/Power Query modeling for impact frameworks.
The cost of UpMetrics' impact reporting platform can vary based on the number of users, dashboards, and data tables your organization needs. It’s best to reach out directly to UpMetrics so they can scope the right solution for you.
It’s easy—contact the team below to discuss your goals and how you might use the platform.
If you’re a foundation or grantmaker, you can sponsor a Cohort program to provide partner organizations with platform access, peer learning, and hands-on coaching.