BlueMark IQ offers LPs and fund managers tools to gauge the impact of their investments. Many investors, though, need a solution that gathers evidence closer to the ground: straight from the companies they back.
That's the gap UpMetrics fills. Rather than scoring funds from the outside, UpMetrics works inside your portfolio, connecting you directly to the companies you back so you can collect, analyze, and report on impact together. Let’s explore how the two platforms stack up.
.webp?width=2000&name=upmetrics%20vs%20bluemarkiq%20-%20feature%20(1).webp)







.webp?width=600&height=168&name=HCAP-Partners%20(1).webp)












.webp?width=1600&height=1200&name=Metrics%20%26%20KPIs%20-%20Product%20Shot%20(4).webp)
BlueMark IQ assembles information at the fund level, requesting performance data from fund managers. UpMetrics is built for organizations that invest in or fund companies directly, allowing them to request information from each portfolio company. Reporting partners get a no-cost login to communicate with colleagues and see where each submission stands.
UpMetrics' Stories feature organizes interviews, founder quotes, photos, and other qualitative datapoints into coded categories and displays them within the same live dashboards as your indicators. Investment committees and LPs can see the outcome and the human context in a single view.
%20(1).webp?width=1600&height=1200&name=upmetrics%20vs%20bluemark%20iq%20-%20Stories%20-%20Product%20Shot%20v2%20(1)%20(1).webp)
.webp?width=1600&height=1200&name=Dashboard%20-%20Product%20Shot%20(2).webp)
BlueMark IQ evaluates impact against industry standards using a single standardized IQ score, which can't capture what your programs or portfolio companies are actually working to change. UpMetrics lets you define your own framework and key impact indicators and track the outcomes specific to each program or company, while still mapping to IRIS+, the SDGs, or the Impact Performance Reporting Norms when you need to benchmark.

QUALITATIVE DATA ANALYSIS
Capture the stories, photos, interviews, and testimonials behind your numbers, and make them as analyzable as any quantitative metric.
Structured coding, categories, and program associations let you organize qualitative data right in the platform, no exporting or spreadsheet cleanup required. From there it feeds straight into your dashboards, painting a complete, contextual picture of impact that numbers alone can't tell.
Released August 2026. Learn more →
.png?width=1600&height=1200&name=Stories%20-%20Product%20Shot%20v2%20(1).png)
Portfolio company records often include confidential financial and operational details. UpMetrics holds a SOC 2 Type 2 attestation, an independent audit that its safeguards operate consistently over an extended period.
.webp?width=1600&height=1200&name=upmetrics%20vs%20bluemark%20iq%20-%20Admin%20and%20Security%20-%20Product%20Shots%202026%20(1).webp)
REAL-TIME ANALYTICS & DASHBOARDS
Turn complex impact data into a live, explorable view of performance.
Dashboards update automatically as new data comes in, giving you real-time visibility from individual program results to portfolio-wide trends. Filter by theme, geography, or time period, benchmark across programs, and drill down or roll up as needed. For teams that want to go further, you can write and run custom queries directly against your data for on-demand analysis, without leaving UpMetrics.
It's impact analysis that helps your team make decisions in the moment, not just at year-end.
REUSABLE, READY-TO-SHARE VISUALIZATIONS
Create charts once and reuse them across multiple dashboards — when data updates, every instance updates automatically.
Customize dashboards for different audiences, share via public links or embedded charts without exposing underlying data, and combine metrics with narratives to tell the complete impact story.
No reformatting, no version control. Just current, compelling data wherever your stakeholders need it.
.png)
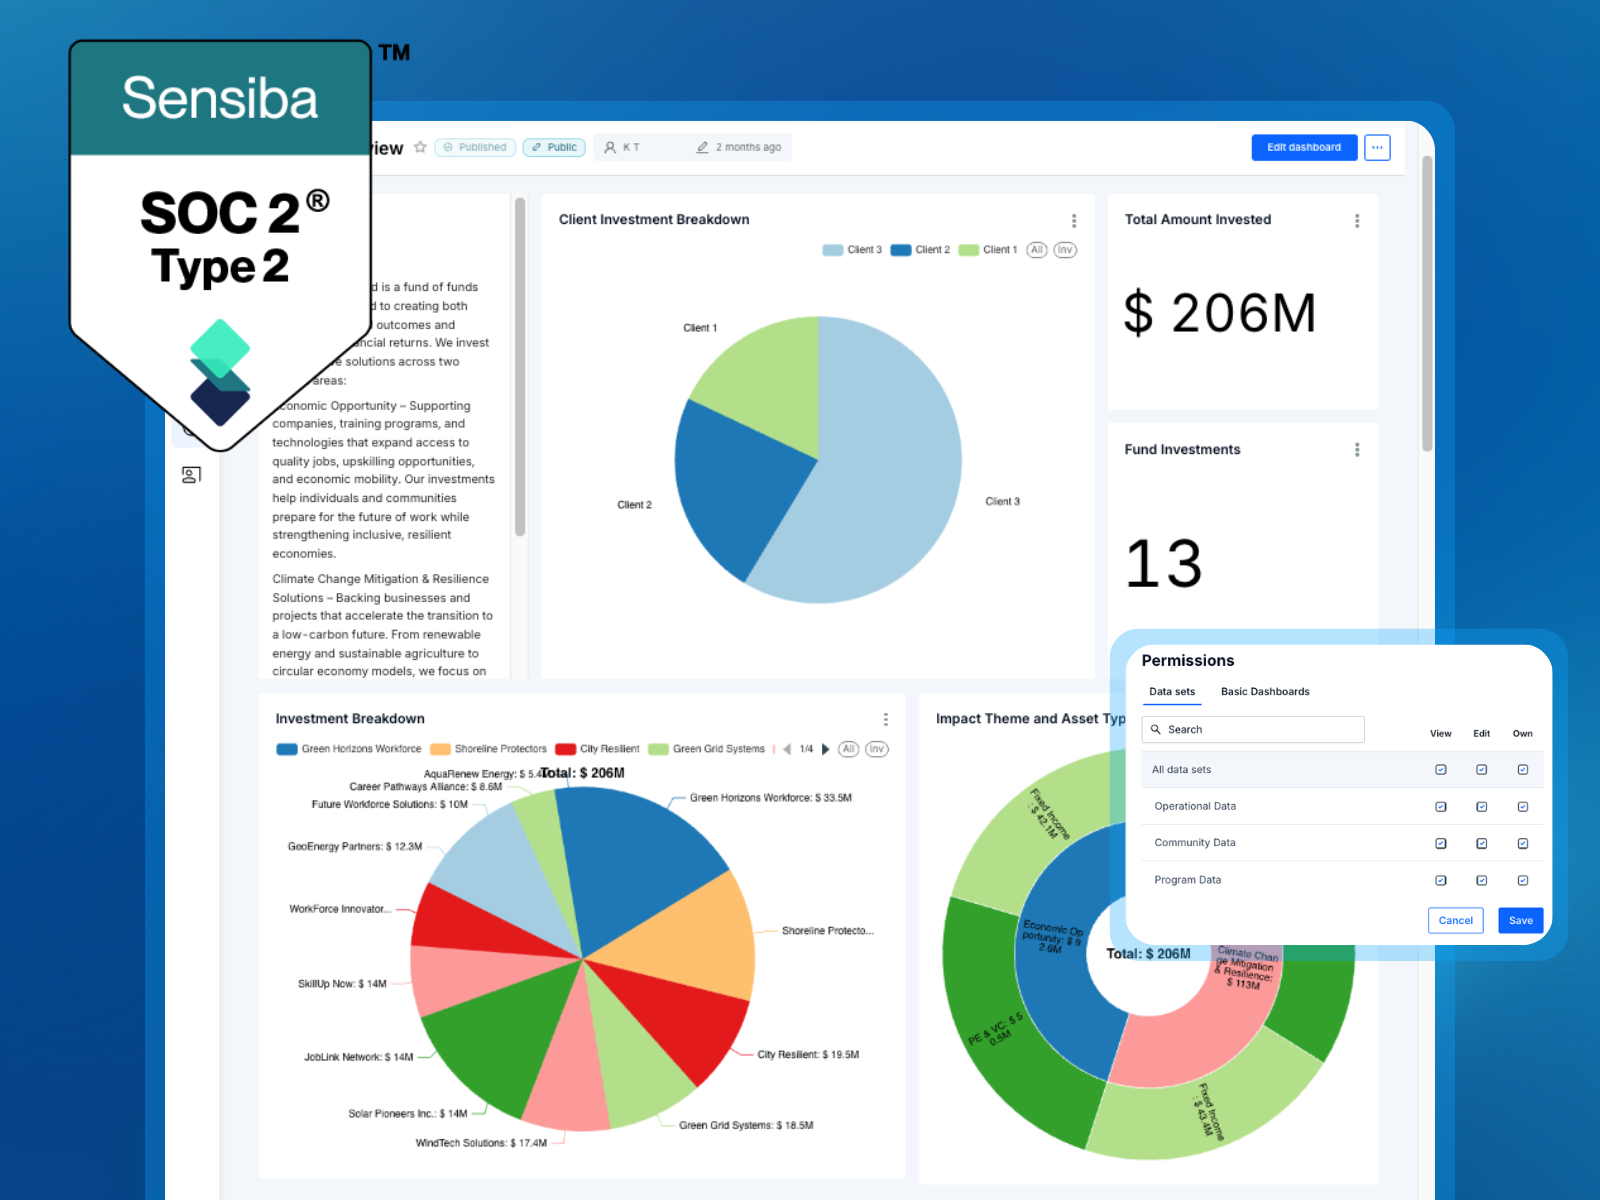
ROBUST SECURITY & ADMIN TOOLS
Role and user-based permissions let program teams, analysts, and leadership self-serve the data they need while keeping sensitive information protected.
UpMetrics' SOC 2 Type 2 certification ensures our security practices are independently audited against enterprise-grade standards, so your organization and stakeholders can trust that sensitive data stays where it belongs.

Stop stitching together survey tools, spreadsheets, emails, and PDFs. UpMetrics centralizes all of your data into one system so you can see the full picture of your impact.

Advanced analytics tools let you set targets, track performance against them, and understand where your impact strategy is working and where it needs attention.

The best reporting cycles don't just produce data, they improve what you do next. UpMetrics helps your team surface trends, flag gaps, and turn every cycle into an opportunity to improve strategy and outcomes.

Reporting shouldn't feel like an audit. UpMetrics creates a shared experience where data flows both ways, feedback is built in, and every cycle strengthens relationships rather than straining them.

Whether you're reporting to a board, presenting to partners, or communicating publicly, UpMetrics make it easy to share compelling and credible impact narratives.

UpMetrics automates the administrative work that consumes your team's time, freeing them to focus on strategy, relationships, and outcome delivery instead.

Easy-to-use ensures new users learn to use prototyping tools.






.png?width=1600&height=1200&name=Dashboard%20-%20Product%20Shot%20(2).png)